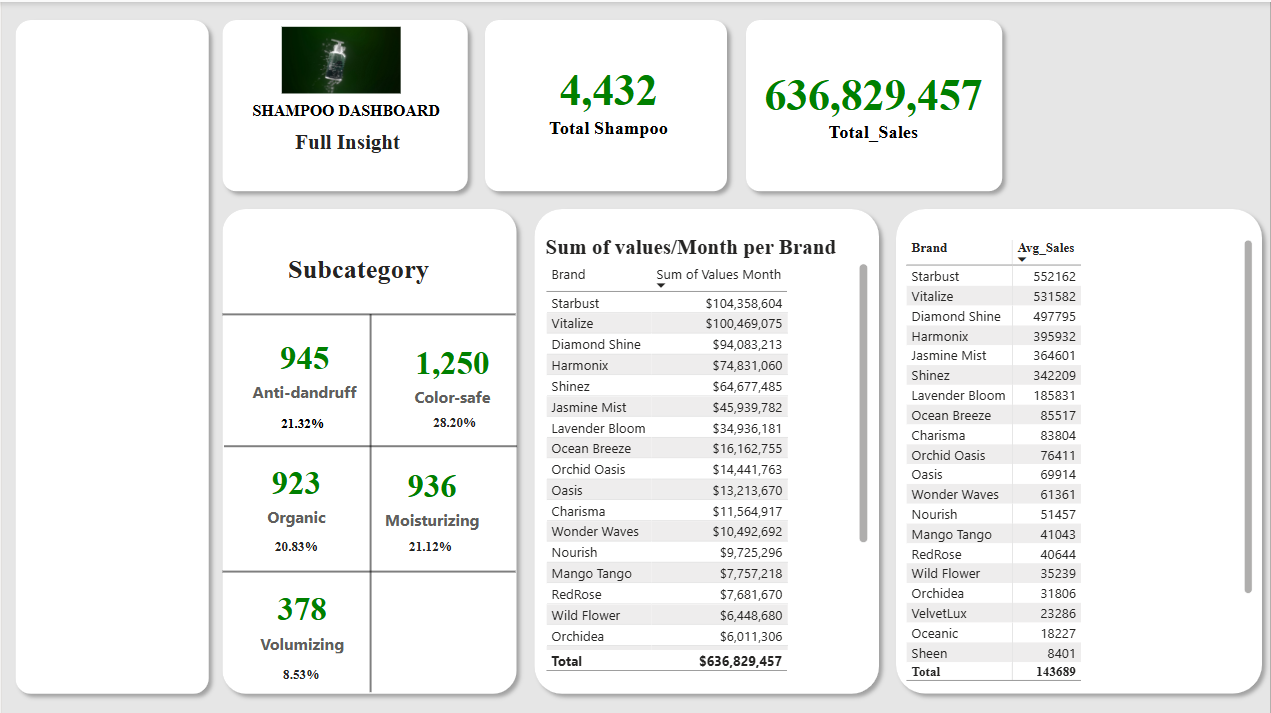
Sales Performance Dashboards & Data Analysis
Excel and Power BI dashboards designed to track sales performance KPIs and trends. Includes pivot tables interactive charts and narrative insights for stakeholders.
Tools: Excel Power BI
Excel and Power BI dashboards designed to track sales performance KPIs and trends. Includes pivot tables interactive charts and narrative insights for stakeholders.
Tools: Excel Power BI
Statistical analysis of program outcomes using SPSS and Excel for Shamiri Institute. Includes descriptive statistics t-tests and outcome reporting to support program evaluation.
Tools: SPSS Excel
Automation scripts and SQL queries for data cleaning ETL and exploratory analysis. Projects are work in progress and will be added to GitHub soon.
Tools: Python SQL

Designs created during an Ajira graphic design course. Simple brand collateral and posters to showcase visual thinking.
Tools: Canva Adobe Illustrator Microsoft Designer Red Bubble Upscayl